Wednesday, May 3
The Linear Regression Model
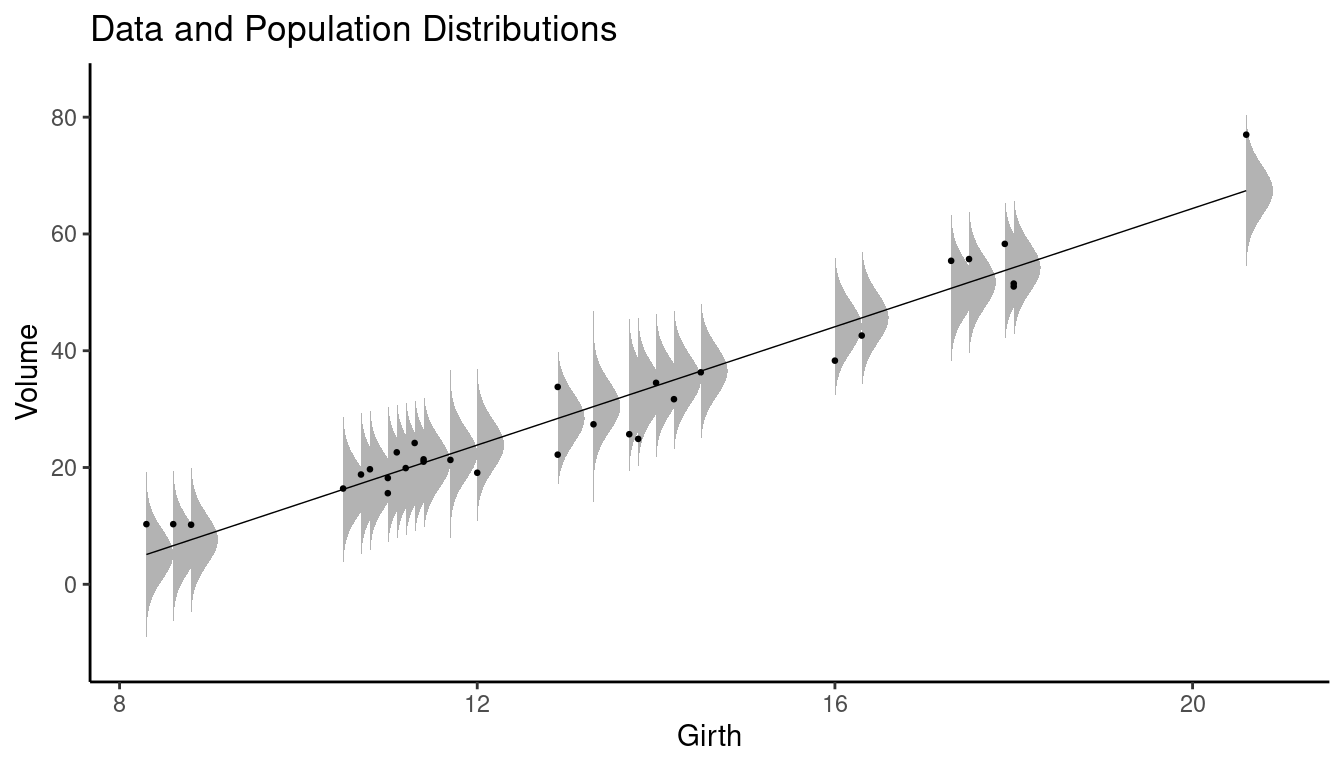
The linear regression model has the form \[ \mu_y = \alpha + \beta x, \] where \(\mu_y\) is the mean of the population distribution of the response variable \(y\) (e.g., mean tree volume), and \(x\) is the value of the explanatory variable (e.g., tree girth). The quantities \(\alpha\) and \(\beta\) are the intercept and slope parameters, respectively.
Study Question: What do the four symbols in \(\mu_y = \alpha + \beta x\) represent?
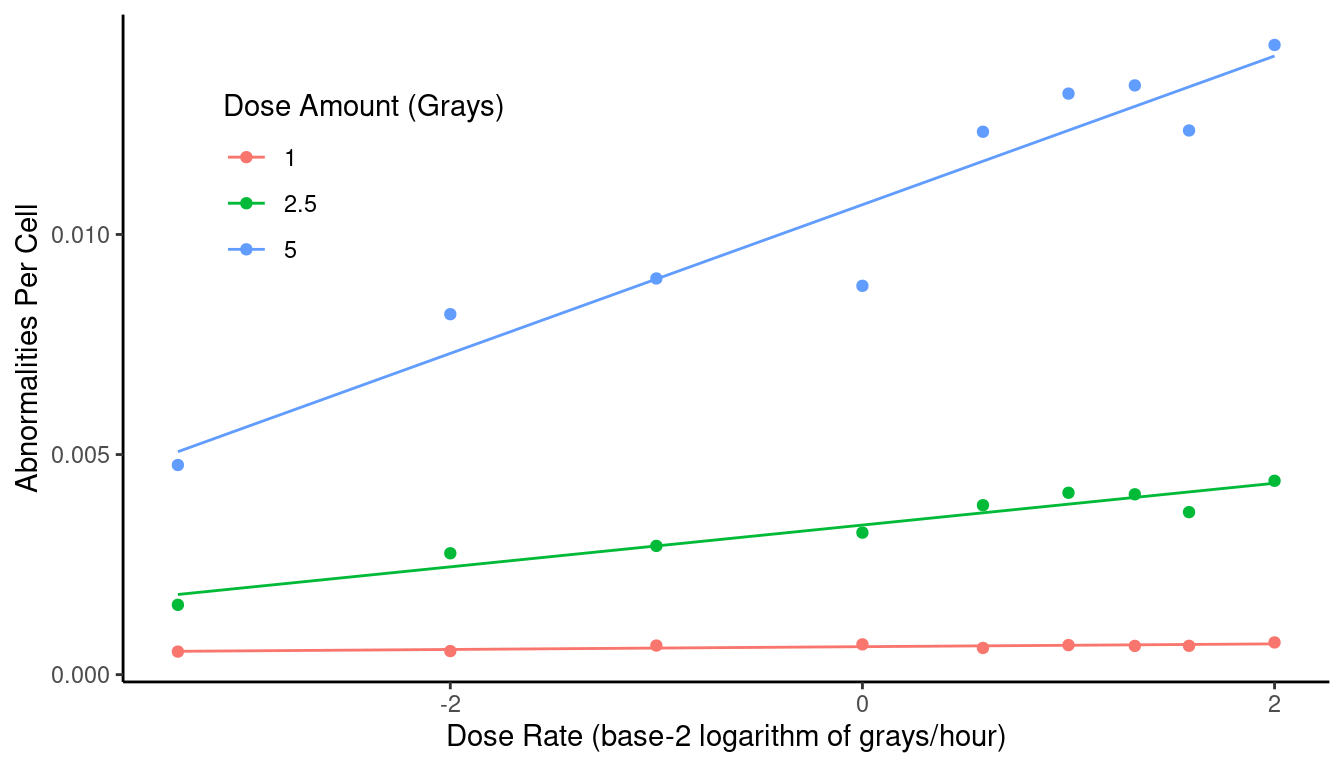
Example: The plot below shows the data from a study
of the relationship between the number of chromosomal abnormalities per
cell (\(\mu_y\)) and the rate of
exposure to gamma radiation (\(x\)).
But this relationship was studied at three different total dose amounts.
Three linear regression models are used here.
Multiple Linear Regression
The multiple linear regression model has the form \[ \mu_y = \alpha + \beta_1 x_1 + \beta_2 x_2 + \cdots + \beta_k x_k \] where \(x_1, x_2, \dots x_k\) are the values of \(k\) explanatory variables. For example, we might have \[ \mu_y = \alpha + \beta_1 x_1 + \beta_2 x_2 \] where \(\mu_y\) is the mean of the population distribution of the response variable \(y\) (e.g., mean tree volume), \(x_1\) is the value of one explanatory variable (e.g., tree girth), and \(x_2\) is the value of a second explanatory variable (e.g., tree height).
The generic term linear regression is usually used to refer to the case where there is one or more explanatory variables. The case where there is only one explanatory variable is sometimes referred to as simple linear regression.
Study Question: How is multiple linear regression different from simple linear regression?
Nonlinear Regression
A nonlinear regression model is any regression model that cannot be written as \[ \mu_y = \alpha + \beta x \] or \[ \mu_y = \alpha + \beta_1 x_1 + \beta_2 x_2 + \cdots + \beta_k x_k. \]
Study Question: What is nonlinear regression?
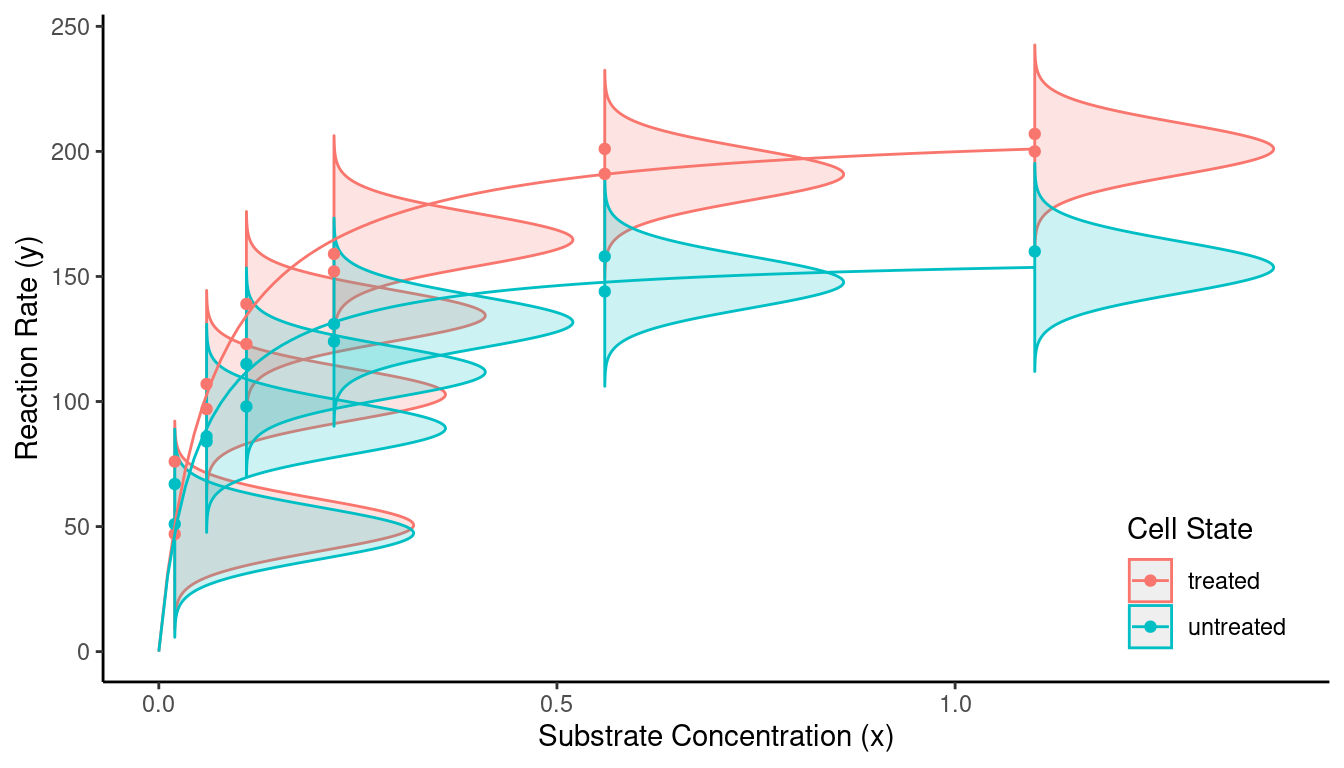
Example: In biochemistry, the relationship between
the mean reaction rate (\(\mu_y\)) and
the concentration of a substrate (\(x\)) is often modeled as \[
\mu_y = \frac{\delta x}{\gamma + x}.
\] Here \(\delta\) is the
maximum achievable mean reaction rate, and \(\gamma\) is the substrate concentration
that yields a mean reaction rate half way between 0 and \(\delta\).
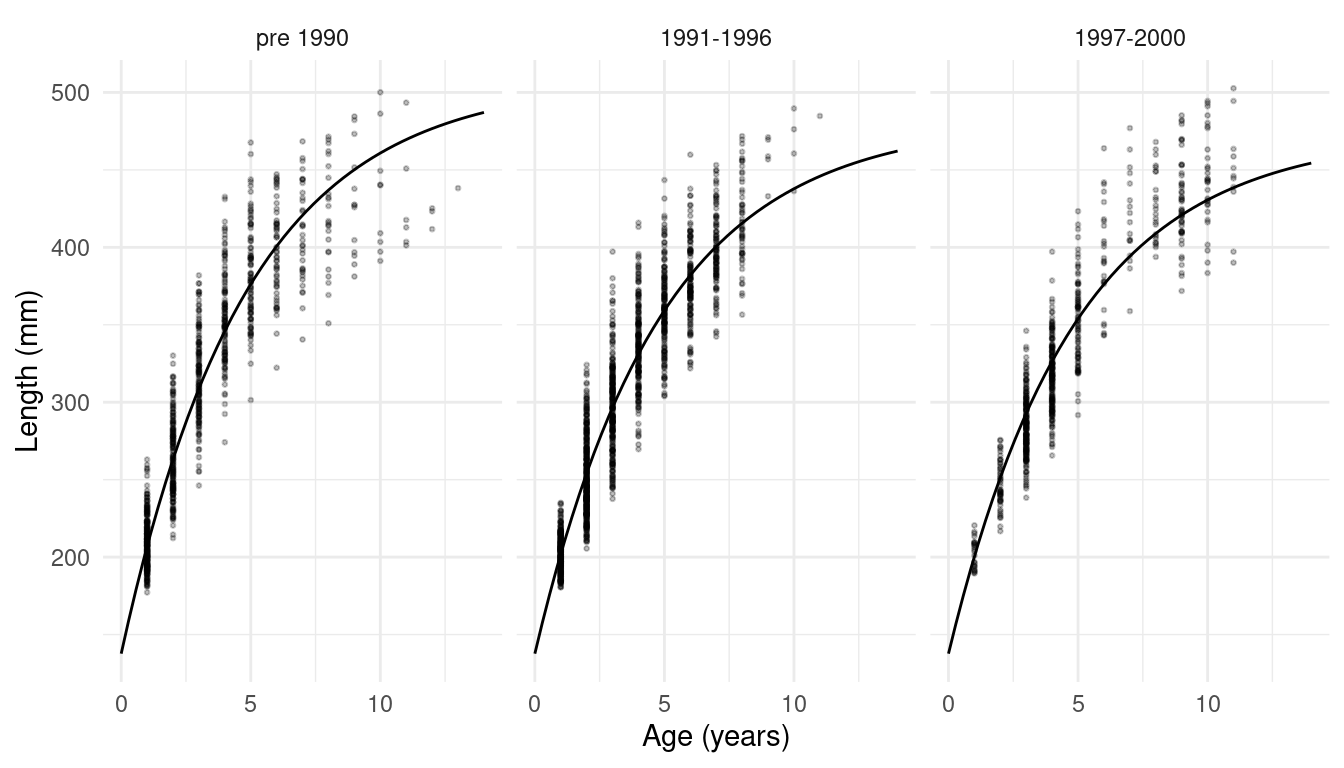
Example: In fisheries science, a nonlinear
regression model (the von Bertalanffy model) is used to model
the relationship between mean length (\(\mu_y\)) and age (\(x\)) of fish. This model can be written as
\[
\mu_y = \alpha + (\delta - \alpha)e^{-x\log(2)/\gamma}.
\] Here \(\alpha\) is the
maximum value of \(\mu_y\) that we
approach as fish age, \(\delta\) is the
value of \(\mu_y\) before they reach
one year of age, and \(\gamma\) is how
many years it takes for \(\mu_y\) to be
half way between \(\delta\) and \(\alpha\).
Categorical Explanatory Variables
What if we have one or more categorical explanatory variables? Regression can accommodate categorical explanatory variables using some tricks. But often the statistical methodology is described as the analysis of variance (ANOVA).
Example: The dot plots below show four samples of
observations of the variable anger reduction. The four samples
correspond to four levels of a categorical treatment variable of
anger management exercises (none, physical, behavioral, and
both physical and behavioral).
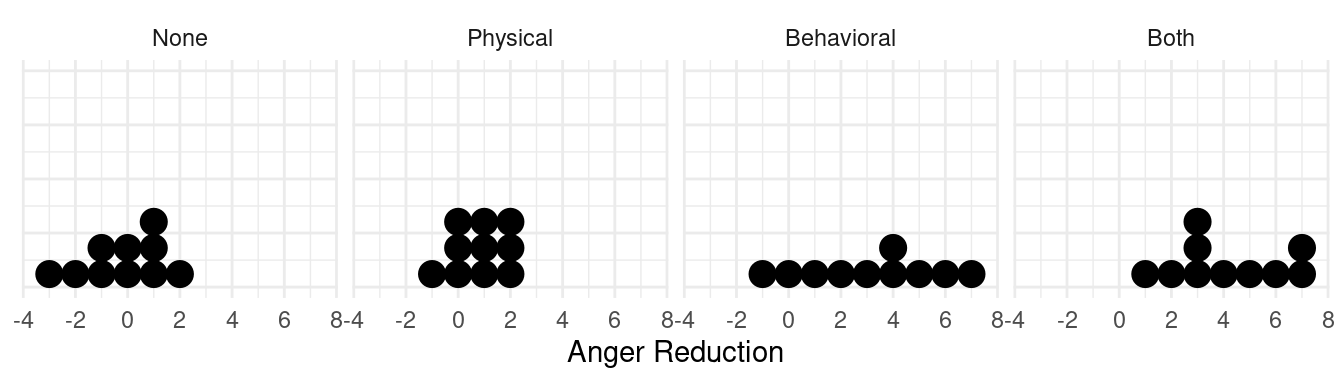 Here are some descriptive statistics for each group.
Group | n | mean | sd |
|---|---|---|---|
None | 10 | -0.2 | 1.5 |
Physical | 10 | 0.8 | 1.0 |
Behavioral | 10 | 3.1 | 2.6 |
Both | 10 | 4.1 | 2.1 |
Possible research questions to address using statistical inference:
- Are physical exercises effective for anger reduction?
- Are behavioral exercises effective for anger reduction?
- Is one type of exercise more effective than the other?
- Is it useful to use both types of exercises rather than just one?
Example: The histograms below show data from an
observational study of the effect of warning signs on car speed. Here
there are two categorical explanatory variables: warning (yes
or no) and period (before, short, and long).
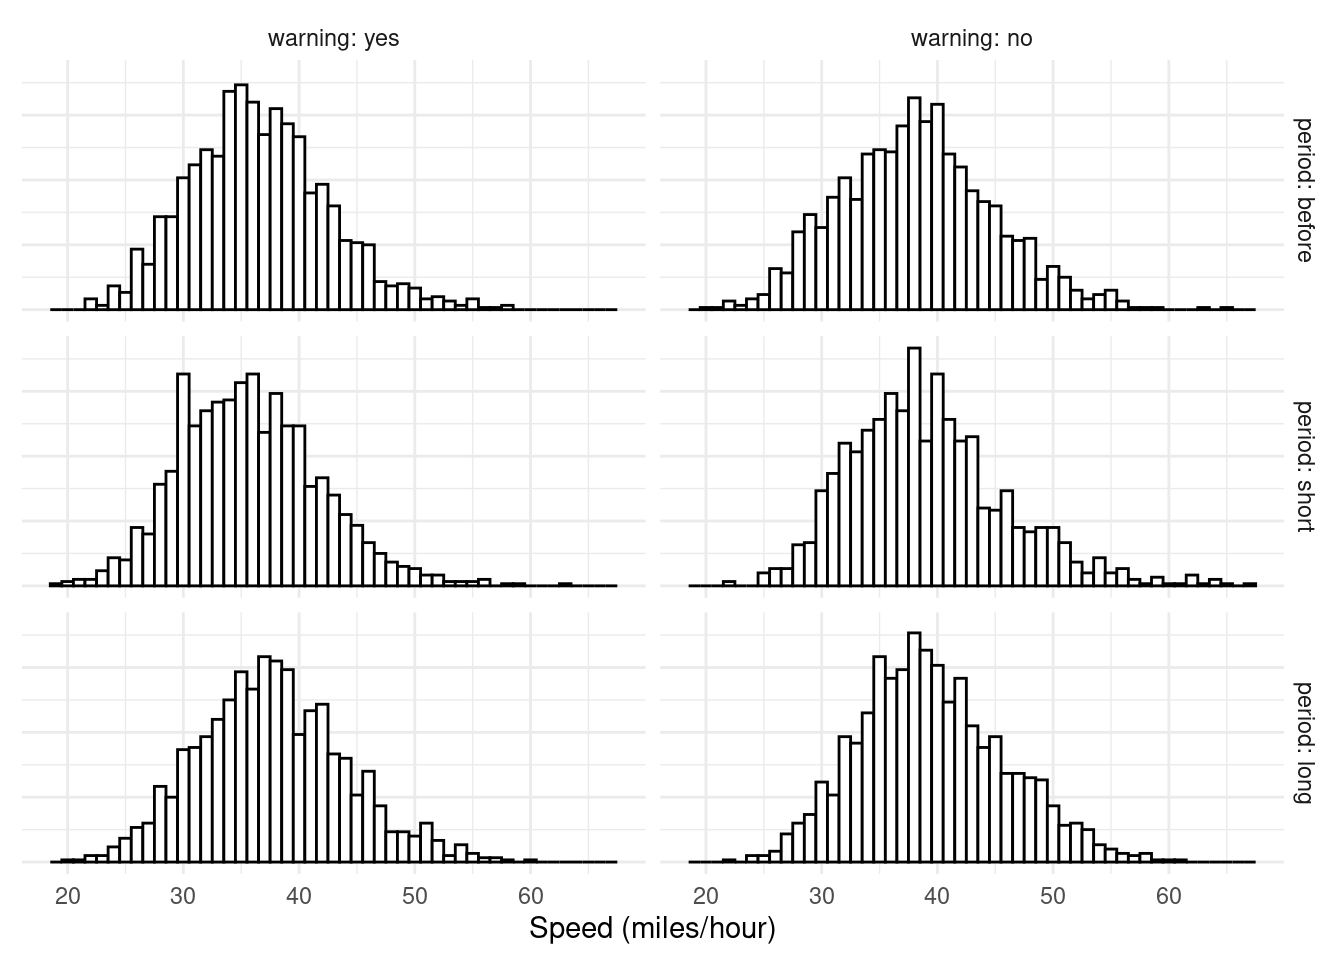 Here are some descriptive statistics for each group.
warning | period | n | mean | sd |
|---|---|---|---|---|
yes | before | 1,400 | 36.5 | 6.0 |
yes | short | 1,400 | 35.8 | 6.1 |
yes | long | 1,362 | 37.7 | 6.4 |
no | before | 1,400 | 38.2 | 6.6 |
no | short | 1,400 | 39.2 | 6.8 |
no | long | 1,475 | 39.5 | 6.4 |
Possible research questions to address using statistical inference:
- How much (if at all) does a warning sign decrease average speed?
- How does time affect the effectiveness of a warning sign on reducing speed?
Study Question: When would a researcher use an analysis of variance?