Wednesday, Apr 5
You can also download a PDF copy of this lecture.
Explanatory and Response Variables
Frequently when looking at the relationship between two variables we consider the distribution of a response variable (also known as a “dependent variable”) for each value of an explanatory variable (also known as an “independent variable”). The question we often have is if/how does the distribution of the response variable change when the value of the explanatory variable changes.
Example: Dot plots of samples of observations of
beak size from before (1976) and after (1978) a drought in 1977.
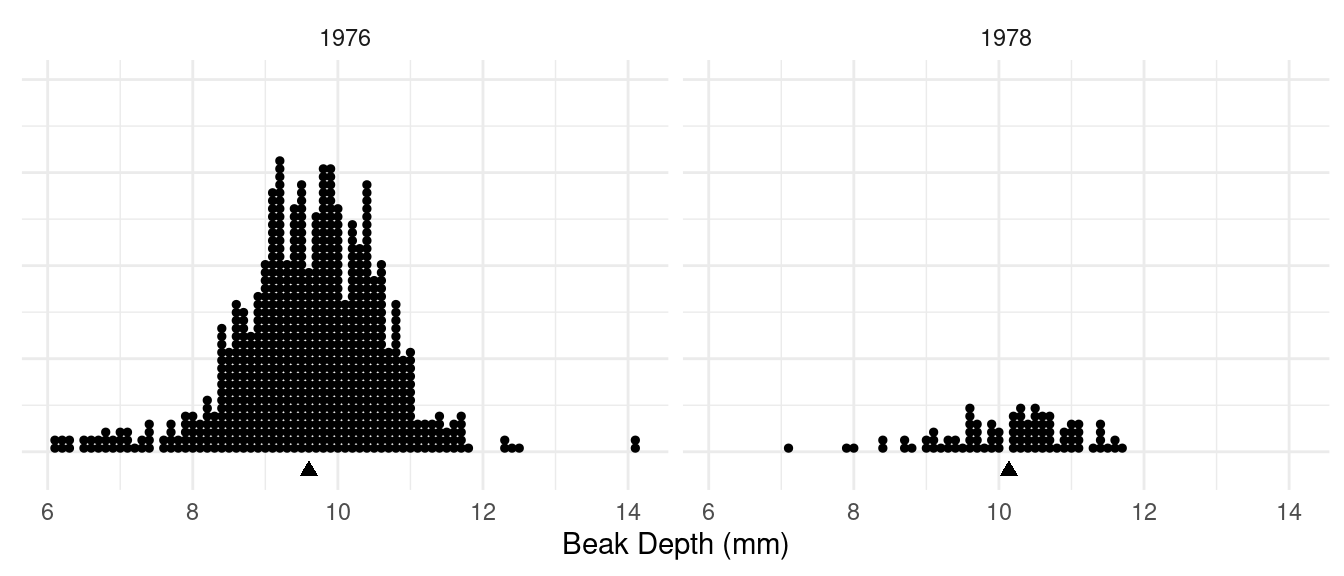 What are the response and explanatory variables?
Example: Creative writing students were “primed” with either extrinsic or intrinsic motivation. They were then asked to write a poem in the Haiku style about laughter. Each poem was then scored for “creativity” on a 40-point scale by judges.
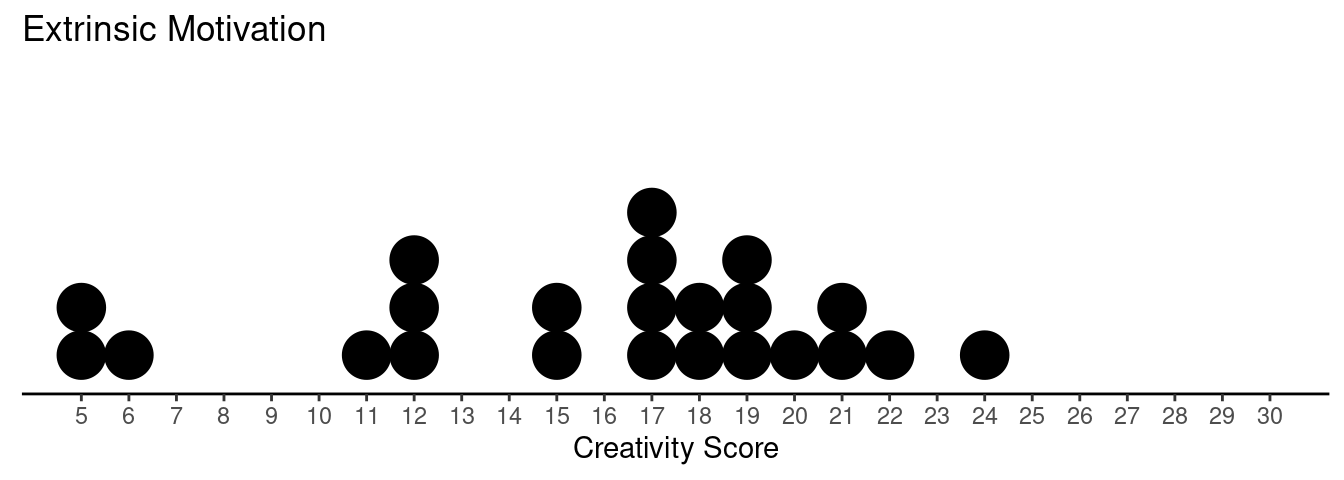
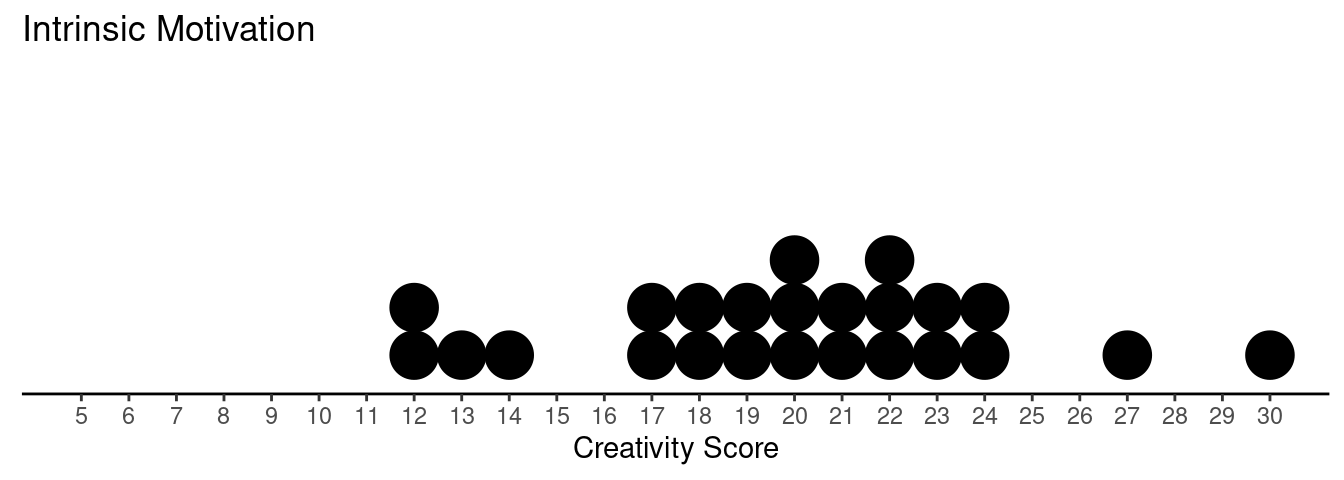 What are the response and explanatory variables?
Average Treatment Effect
Sometimes our goal is to estimate the average treatment effect, which is the average change in the response variable caused by changing the explanatory variable from one value to another.
The difference \(\mu_1-\mu_2\) or \(p_1-p_2\) is the average treatment effect provided that the difference between the parameters is not, in part, caused by any confounding variables.
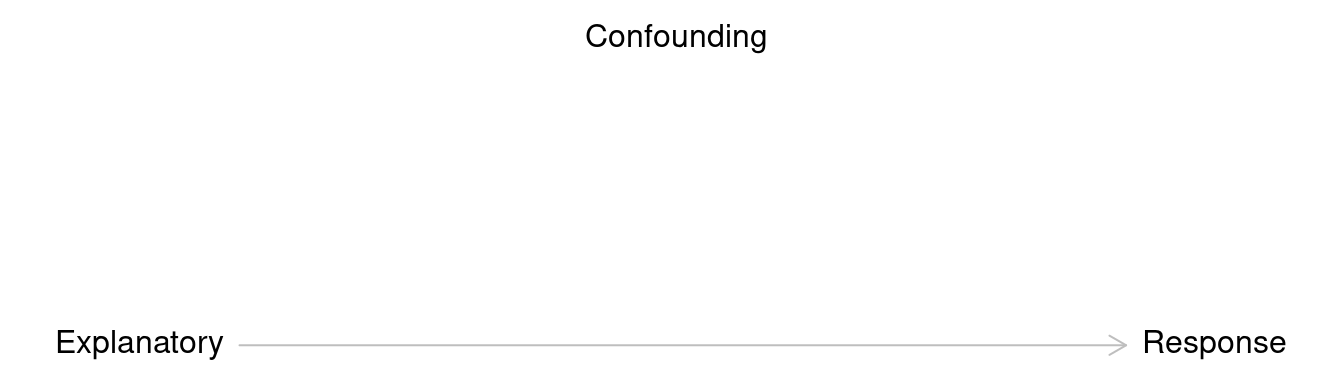
Confounding Variables
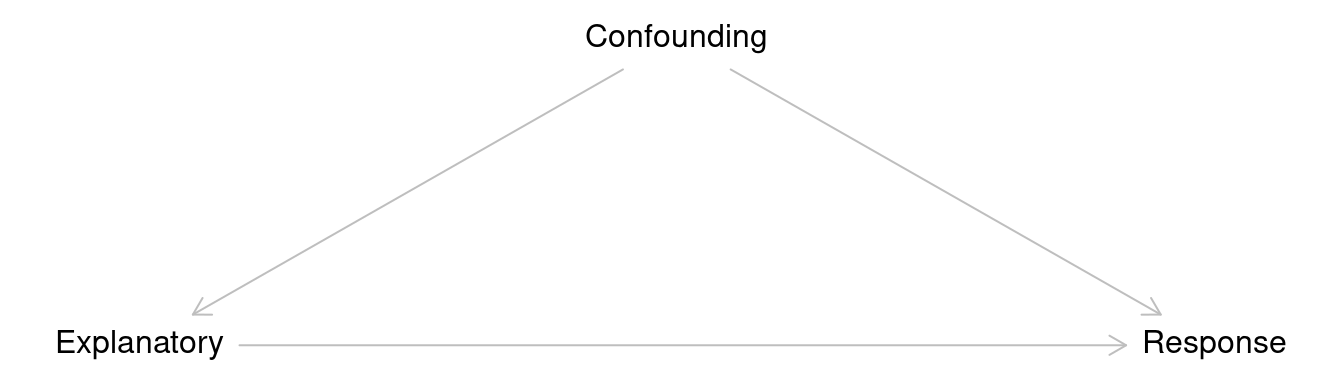
A confounding variable (sometimes called a
lurking variable) is a variable with a causal effect on both
the explanatory and response variables.
 Failure to deal with confounding variables can result in a biased
estimate of the average treatment effect. Three methods of dealing with
confounding variables are conditioning, randomization,
and instrumental variables.
Failure to deal with confounding variables can result in a biased
estimate of the average treatment effect. Three methods of dealing with
confounding variables are conditioning, randomization,
and instrumental variables.
Conditioning
By conditioning we “hold constant” the confounding
variable when estimating the average treatment effect. If the
confounding variable is constant it cannot have a causal effect on the
explanatory or response variables.
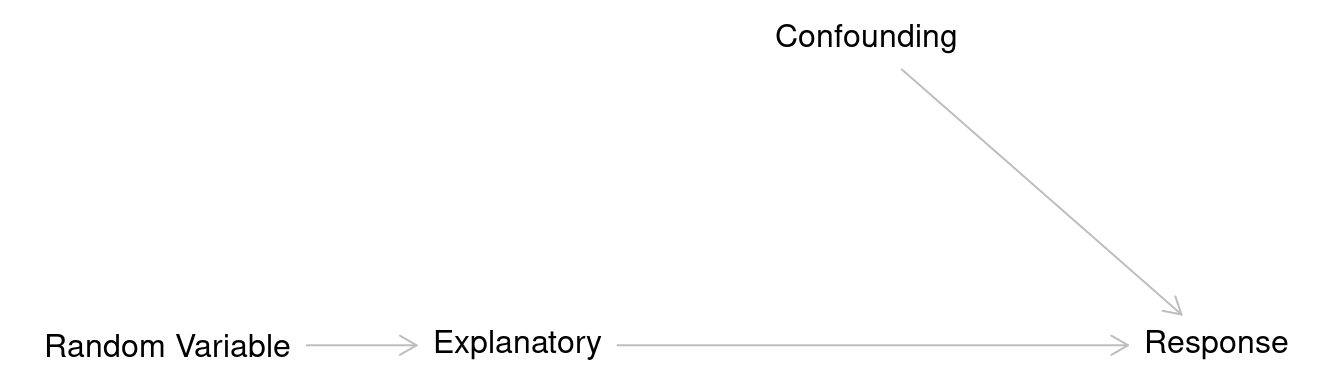
Randomization
With randomization we allow only a random
variable (e.g., coin flip, dice roll) to have a causal effect the
explanatory variable. Then any confounding variables cannot have a
causal effect the explanatory variable.
The presence of randomization is often used to distinguish between (randomized) experiments and observational studies.
In an experiment the researchers control the value of the explanatory variable, typically through the use of randomization.
In an observational study the researchers do not control the value of the explanatory variable.
Instrumental Variable
An instrumental variable is a variable that has a
causal effect the explanatory variable, but does not (directly) have a
causal effect on the response variable, and does not affect and is not
affected by any confounding variables.
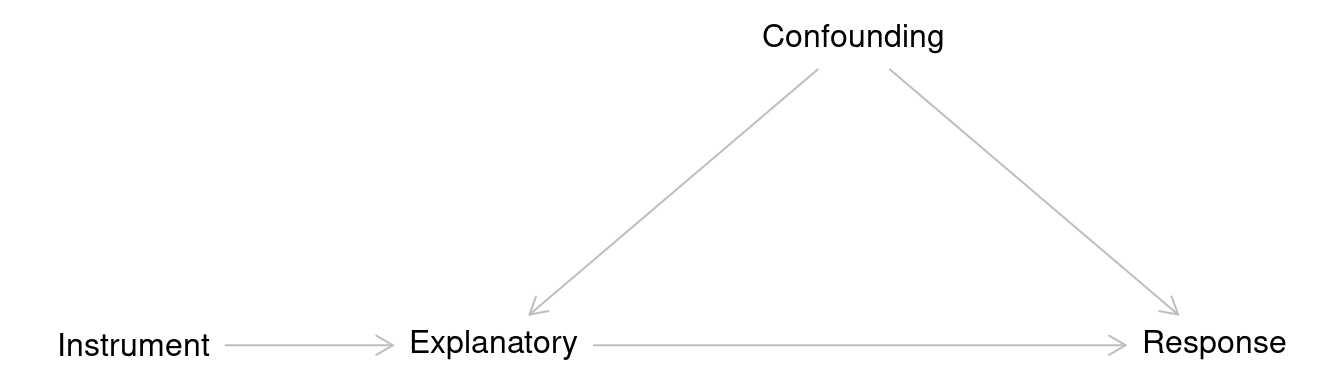 The treatment effect can then be adjusted to “remove” the effect of any
confounding variables.
The treatment effect can then be adjusted to “remove” the effect of any
confounding variables.
Direct Versus Indirect Effects
Causal effects of an explanatory variable on a response variable can be direct and indirect. It is sometimes important to be able to distinguish between these two kinds of effects. Two examples of indirect effects are the placebo effect and the observer-expectancy effect.
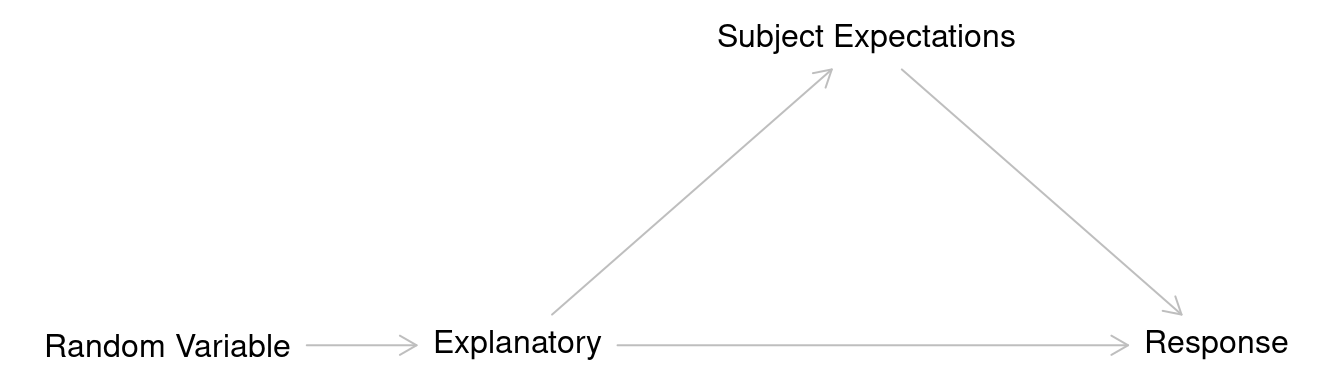
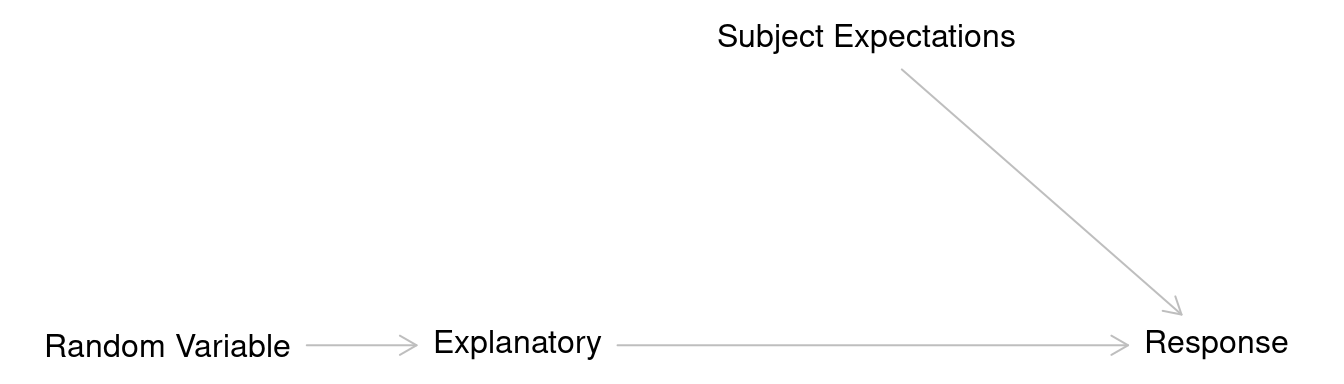
Placebo Effect
The placebo effect can be characterized by an
indirect causal effect of the explanatory variable on subject
expectations, which in turn has a causal effect on the response
variable.
 Use of a single-blind can eliminate the indirect causal
effect of the explanatory variable through subject expectation, so the
causal effect of the explanatory variable is only direct.
Use of a single-blind can eliminate the indirect causal
effect of the explanatory variable through subject expectation, so the
causal effect of the explanatory variable is only direct.
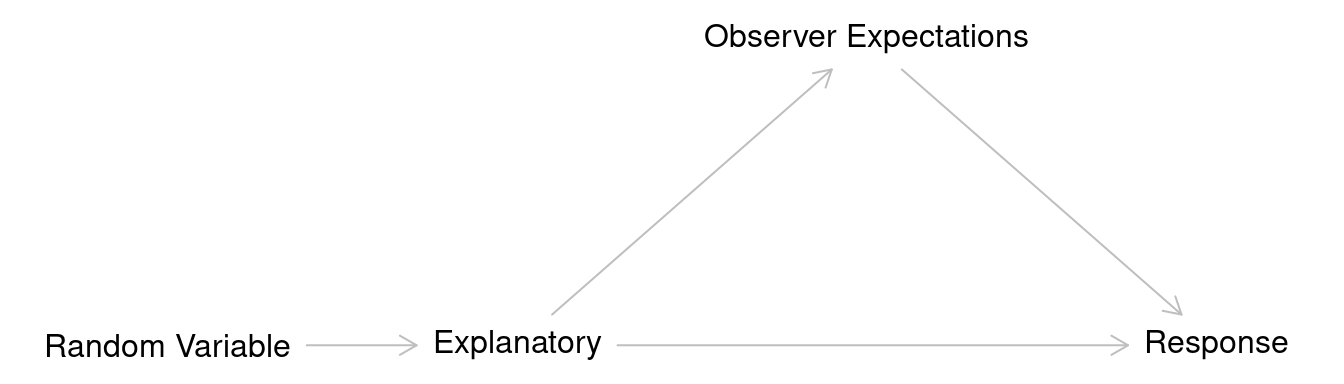
Observer-Expectancy Effect
The observer-expectancy effect is when the
explanatory variable has a causal effect on the expectations of the
observer, which in turn has a causal effect on the response variable.
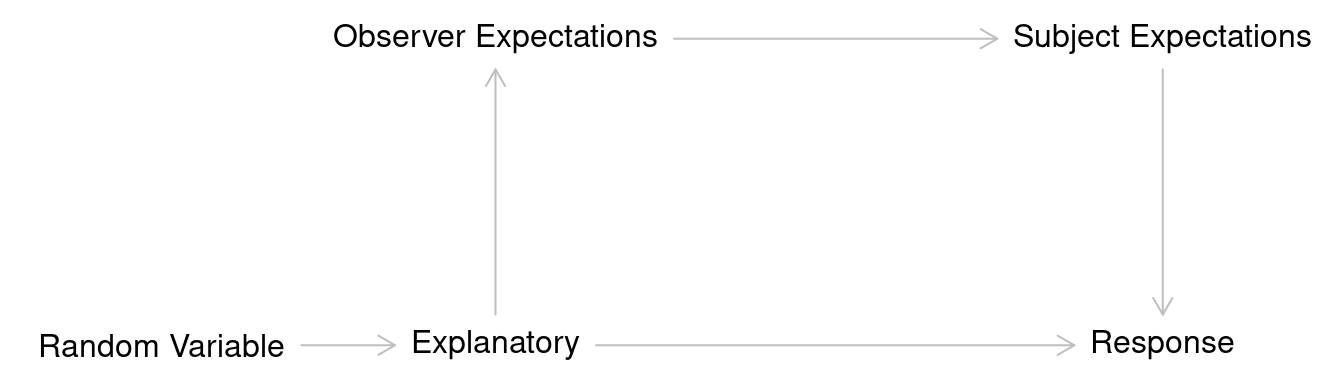
 This effect can also occur when the observer expectation has a causal
effect on the subject expectation, which then has a causal effect on the
response variable.
This effect can also occur when the observer expectation has a causal
effect on the subject expectation, which then has a causal effect on the
response variable.
 Use of a double-blind can eliminate the indirect causal
effect of the explanatory variable on observer expectations, so the
causal effect of the explanatory variable is only direct.
Use of a double-blind can eliminate the indirect causal
effect of the explanatory variable on observer expectations, so the
causal effect of the explanatory variable is only direct.