Homework Problem Set 14: Inferences for \(\mu_1-\mu_2\) from Independent Samples
You can also download a PDF copy of this homework assignment.
Instructions: These homework problems will help familiarize you with how we can make inferences concerning the difference between two means (i.e., \(\mu_1 - \mu_2\)). For statistical tests state appropriate null and alternative hypotheses, compute the test statistic, compute the p-value, and make a decision/conclusion. Use a significance level of \(\alpha\) = 0.05. For confidence intervals use a confidence level of 95%. The solutions are given at the end.1
Bumpus’ Sparrows
A famous lecture
by biologist Hermon
Bumpus demonstrated natural selection using data concerning the
survival of house sparrows (Passer domesticus) after a severe
winter storm.2 After the storm moribund sparrows were
brought to the Anatomical Laboratory at Brown University. Some of these
sparrows were revived, but many died. All of the sparrows that were
brought in were examined with respect to a variety of anatomical
characteristics. It is interesting to compare the anatomical
characteristics of sparrows that survived versus those that did not. The
distributions of humerus (upper wing bone) length in the samples of
sparrows that survived and the sparrows that did not are shown below.
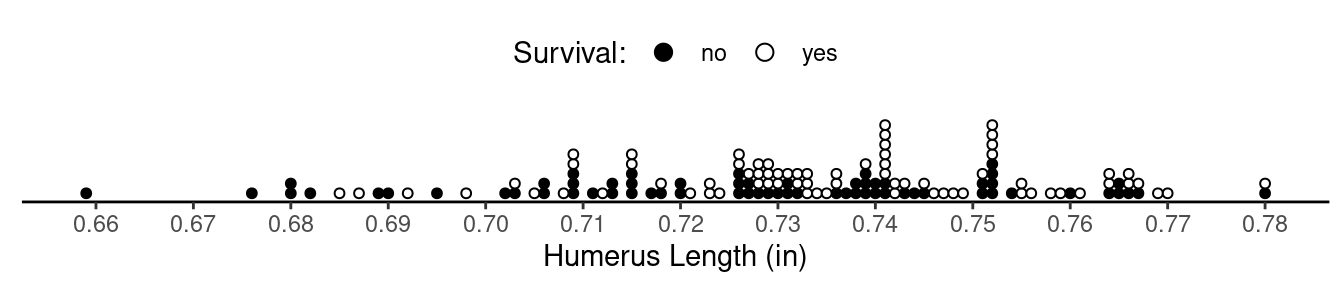 Of the sample of 72 observations for sparrows that survived, the mean
humerus length was 0.74 in, and the standard deviation was 0.02 in. And
of the sample of 64 observations for sparrows that died, the mean
humerus length was 0.73 in, and the standard deviation was 0.03 in. Let
\(\mu_s\) denote the mean for the
population distribution of humerus length for sparrows that would
survive, and let \(\mu_d\) denote the
mean for the population distribution of humerus length for sparrows that
would not survive. Bumpus would probably have pointed out that sparrows
that survived tended to have a larger humerus length than those that did
not. While this is true for his samples, it is not clear if we can infer
from this that this is true in general (i.e., \(\mu_s > \mu_d\)). Conduct a statistical
test to determine if the difference in the sample means is statistically
significant or not using the hypotheses \(H_0:
\mu_s-\mu_d = 0\) versus \(H_a:
\mu_s-\mu_d > 0\). Also estimate the difference in mean
humerus length (\(\mu_s-\mu_d\)) using
a confidence interval.
Of the sample of 72 observations for sparrows that survived, the mean
humerus length was 0.74 in, and the standard deviation was 0.02 in. And
of the sample of 64 observations for sparrows that died, the mean
humerus length was 0.73 in, and the standard deviation was 0.03 in. Let
\(\mu_s\) denote the mean for the
population distribution of humerus length for sparrows that would
survive, and let \(\mu_d\) denote the
mean for the population distribution of humerus length for sparrows that
would not survive. Bumpus would probably have pointed out that sparrows
that survived tended to have a larger humerus length than those that did
not. While this is true for his samples, it is not clear if we can infer
from this that this is true in general (i.e., \(\mu_s > \mu_d\)). Conduct a statistical
test to determine if the difference in the sample means is statistically
significant or not using the hypotheses \(H_0:
\mu_s-\mu_d = 0\) versus \(H_a:
\mu_s-\mu_d > 0\). Also estimate the difference in mean
humerus length (\(\mu_s-\mu_d\)) using
a confidence interval.
Experimental Investigation of the Peak-End Rule
The peak-end rule is a psychological heuristic where people tend to judge an experience disproportionately based on how the felt at the peak of the experience (i.e., at the point of maximum pleasure or pain/discomfort) and at the end of the experience. The phenomenon has many implications and potential applications. Do, Rupert, and Wolford (2008) conducted randomized experiments that demonstrate the peak-end rule.3 In one experiment subjects were contacted by email to tell them they had won a raffle they had entered after making a donation in a fundraiser. The fundraiser was a real but the “raffle” was organized by the researchers for the purpose of the study. Subjects that replied were randomly assigned to one of two treatment conditions. The reward for the raffle was to select a DVD from one or both of two lists. List A consisted of 10 movies that were all highly rated. List B consisted of a different 10 movies that were not so highly rated. In one treatment condition the subjects were first allowed to pick a movie from list A, and were then contacted in another email and allowed to select a movie from list B (denote this treatment condition as “A+B”). In the other treatment condition the subjects were only allowed to pick from list A (let this treatment condition be denoted simply as “A”). After selecting their DVD(s), subjects were contacted again by email and asked to rate the overall experience on an integer scale from 1 (least pleased) to 7 (most pleased). Of the 21 subjects who selected movies from both list A and B, the mean rating was 4.14 and the standard deviation was 1.19, but of the 29 subjects who selected movies from only list A, the mean rating was 5.21 and the standard deviation was 0.92. The sample sizes, means, and standard deviations (SD) are also shown in the table below.| Treatment | Size | Mean | SD |
|---|---|---|---|
| A | 29 | 5.21 | 0.92 |
| A+B | 21 | 4.14 | 1.19 |
While objectively the A+B treatment condition rewards the subjects more, it has a less pleasurable end than the A treatment condition, which may lead people to tend to perceive the experience in A to be more pleasurable than that in A+B. Let \(\mu_a\) and \(\mu_{ab}\) denote the mean for two hypothetical population distributions of observations of ratings corresponding to the A and A+B treatment conditions, respectively. Conduct a statistical test with the alternative hypothesis that the peak-end rule results in higher ratings, on average, for treatment condition A than for treatment condition A+B (i.e., \(\mu_a > \mu_{ab}\)).
Age of Onset of Schizophrenia
The German psychiatrist Emil Kraepelin
published one of the early scientific treatments of what was at the time
(incorrectly) labelled dementia praecox (i.e., premature
dementia) but what later became known as schizophrenia.4 Some data from that
work shows the age of onset in some women and men who had been diagnosed
with dementia praecox.5 These data are shown in the figure below.
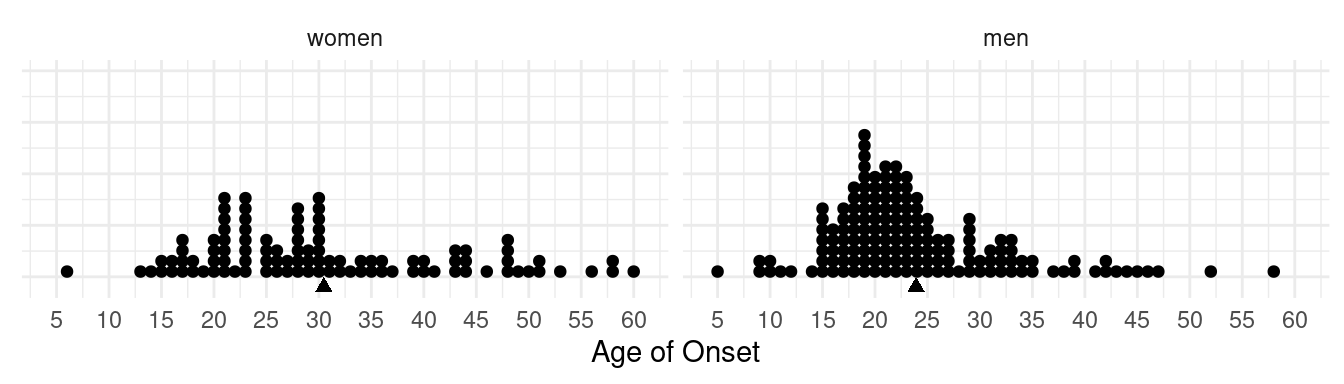 For the sample of 99 women, the mean age of onset was 30.5 years and the
standard deviation was 11.7 years. And for the sample of 152 men, the
mean age of onset was 23.9 years and the standard deviation was 8.6
years. Let \(\mu_w\) and \(\mu_m\) represent the mean for the
population distributions of age of onset for women and men,
respectively. Compute a confidence interval for the difference between
\(\mu_w\) and \(\mu_m\).
For the sample of 99 women, the mean age of onset was 30.5 years and the
standard deviation was 11.7 years. And for the sample of 152 men, the
mean age of onset was 23.9 years and the standard deviation was 8.6
years. Let \(\mu_w\) and \(\mu_m\) represent the mean for the
population distributions of age of onset for women and men,
respectively. Compute a confidence interval for the difference between
\(\mu_w\) and \(\mu_m\).
Reproductive Success of Polyandrous Female Pseudoscorpions
Pseudoscorpions
(Cordylochernes scorpioides) are not scorpions but rather an
arachnid that looks somewhat like a scorpion but without the segmented
tail and stinger. A study by Newcomer, Zeh, and Zeh (1999) investigated
the effects of polyandry on the reproductive success of female
pseudoscorpions.6 Each of 36 female pseudoscorpions was
randomly put into one of two groups. In one group the females each
received two sperm packets from two different males, while in
the other group the females received two sperm packets from the
same male. The number of brood sacs (an external container of
embryos) later produced by each female was counted. The researchers
wanted to determine if the genetic benefits of receiving sperm packets
from different males (as opposed to the same amount of sperm from one
male) would result in greater reproductive success as quantified by the
number of brood sacs produced.
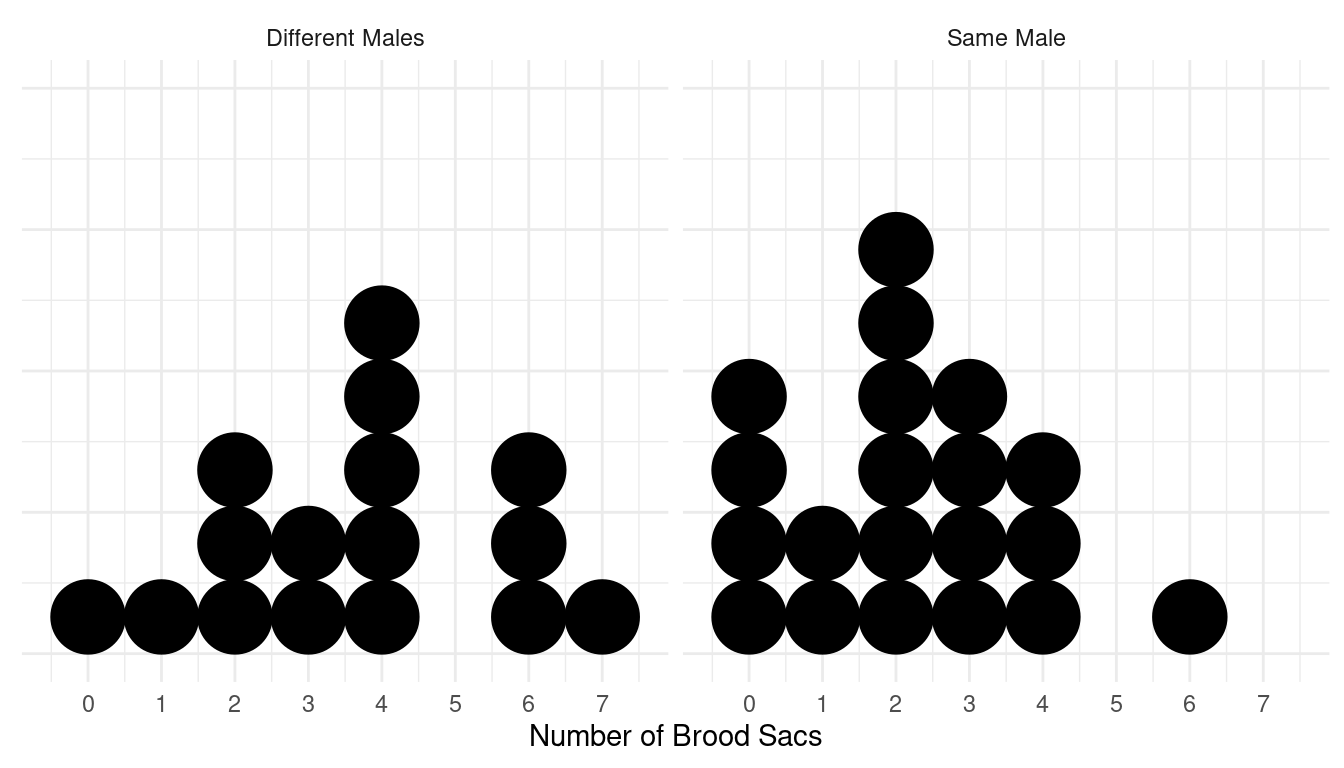 The average number of successful broods produced by females that
received sperm from two different males was 3.62 brood sacs in
comparison to 2.2 brood sacs produced by females that received sperm
from the same male. The standard deviations were similar
between the two treatments: 1.96 brood sacs for the females that
received sperm from different males and 1.61 brood sacs for the females
that received sperm from the same male. Conduct a statistical test to
determine if there is evidence that females that receive sperm packets
from two different males produce more brood sacs, on average, than
females that receive the same number of sperm packs from the same male.
(Note: To find the sample sizes, count the dots in the figure.)
The average number of successful broods produced by females that
received sperm from two different males was 3.62 brood sacs in
comparison to 2.2 brood sacs produced by females that received sperm
from the same male. The standard deviations were similar
between the two treatments: 1.96 brood sacs for the females that
received sperm from different males and 1.61 brood sacs for the females
that received sperm from the same male. Conduct a statistical test to
determine if there is evidence that females that receive sperm packets
from two different males produce more brood sacs, on average, than
females that receive the same number of sperm packs from the same male.
(Note: To find the sample sizes, count the dots in the figure.)
Bumpus’ Sparrows (Solution)
The test statistic is \(t\) \(\approx\) 2.26, which would yield a p-value of approximately 0.014. (Note that the p-value would be twice as large if a two-sided test had been used.) This would lead us to reject the null hypothesis and conclude that there is a statistically significant difference in the mean humerus length between sparrows that survived and those that did not. The confidence interval is approximately 0.01 \(\pm\) 0.009 in.
Experimental Investigation of the Peak-End Rule (Solution)
The hypotheses are \(H_0\!: \mu_a - \mu_{ab} = 0\) versus \(H_a\!: \mu_a - \mu_{ab} > 0\). The test statistic is \(t\) \(\approx\) 3.44, yielding a p-value of approximately 0.001. (Note that the p-value for a two-sided test would be twice as large.) This would lead us to reject the null hypothesis and conclude that, on average, ratings are higher under the A treatment condition than under the A+B treatment condition.
Age of Onset of Schizophrenia (Solution)
You should obtain the confidence interval for \(\mu_w-\mu_m\) of 6.6 \(\pm\) 2.7 years.
Reproductive Success of Polyandrous Female Pseudoscorpions (Solution)
Let \(\mu_d\) and \(\mu_s\) denote the means of the population distributions of the number of brood sacs produced by females receiving sperm from two different males and the same male, respectively. Now consider a test of the hypotheses \(H_0\!: \mu_d - \mu_s = 0\) versus \(H_a\!: \mu_d - \mu_s > 0\). The test statistic is \(t\) \(\approx\) 2.34. This yields a p-value of approximately 0.017. The p-value for a two-sided test would be twice as large. The decision is to reject the null hypothesis and conclude the difference in the mean number of successful broods produced is statistically significant.
In the solutions the reported values of test statistics and p-values have usually been rounded some. Rounding was only done for the final reported values. It was avoided in intermediate calculations (e.g., the value of the test statistic used to compute a p-value was not rounded).↩︎
Bumpus, H. C. (1898). Eleventh lecture. The elimination of the unfit as illustrated by the introduced sparrow, Passer domesticus. (A fourth contribution to the study of variation.) Biological Lectures: Woods Hole Marine Biological Laboratory, 209–225.↩︎
Do, A. M., Rupert, A. V., & Wolford, G. (2008). Evaluations of pleasurable experiences: The peak-end rule. Psychonomic Bulletin & Review, 15(1), 96–998.↩︎
Kraepelin, E. (1919). Dementia praecox and paraphrenia. Edinburgh: Livingstone.↩︎
Age of onset of disorders can be a difficult variable to assess. Sometimes a person’s ability to hide symptoms or their likelihood to be notice by others can affect the apparent age of onset. And when these become confounded with other variables, such as sex, it can make comparisons difficult.↩︎
Newcomer, S. D., Zeh, J. A., & Zeh, D. W. (1999). Genetic benefits enhance the reproductive success of polyandrous females. Proceedings of the National Academy of Sciences, 96, 10236–10241.↩︎