Homework Problem Set 2: Cumulative Distributions, Percentiles, & Box Plots
You can also download a PDF copy of this homework assignment.
Solutions are given at the end.
The following table shows the distribution of a quantitative variable \(x\).
\(x\)
Frequency
Relative Frequency
Cumulative Relative Frequency
4
2
0.02
0.02
5
8
0.08
0.10
6
15
0.15
0.25
7
27
0.27
0.52
8
23
0.23
0.75
9
18
0.18
0.93
10
7
0.07
1.00
Plot the cumulative distribution and use this plot to find the 25th, 50th, and 75th percentiles. Then use the five number summary draw a box plot that represents the distribution, and find the median, range, and interquartile range.
The following table shows the distribution of a quantitative variable \(x\).
\(x\)
Frequency
Relative Frequency
Cumulative Relative Frequency
0
33
0.066
0.066
1
91
0.182
0.248
2
122
0.244
0.492
3
123
0.246
0.738
4
90
0.180
0.918
5
31
0.062
0.980
6
9
0.018
0.998
7
1
0.002
1.000
Plot the cumulative distribution and use this plot to find the 25th, 50th, and 75th percentiles. Then use the five number summary draw a box plot that represents the distribution, and find the median, range, and interquartile range.
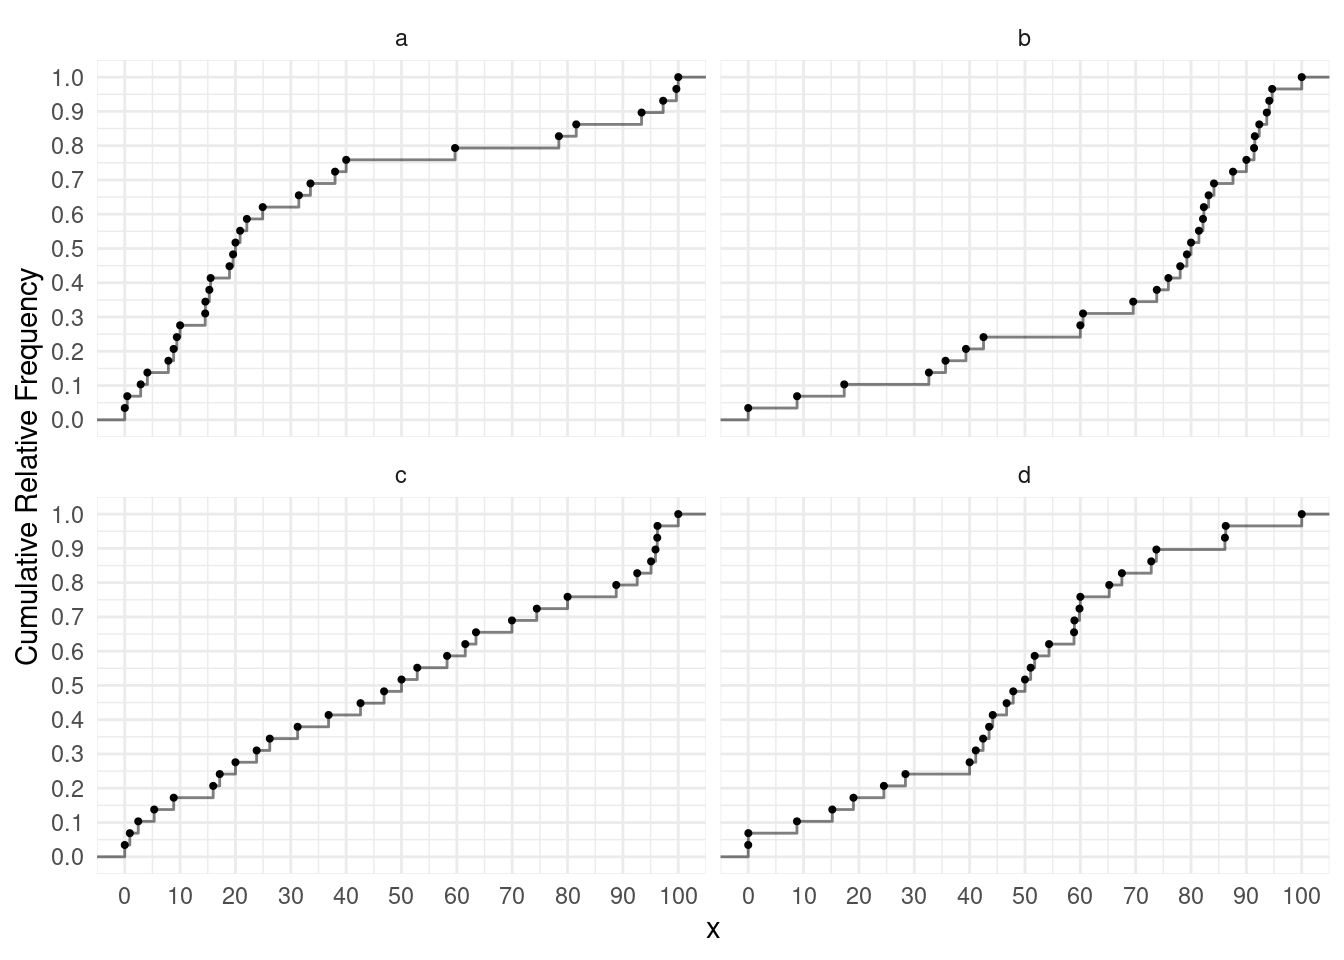
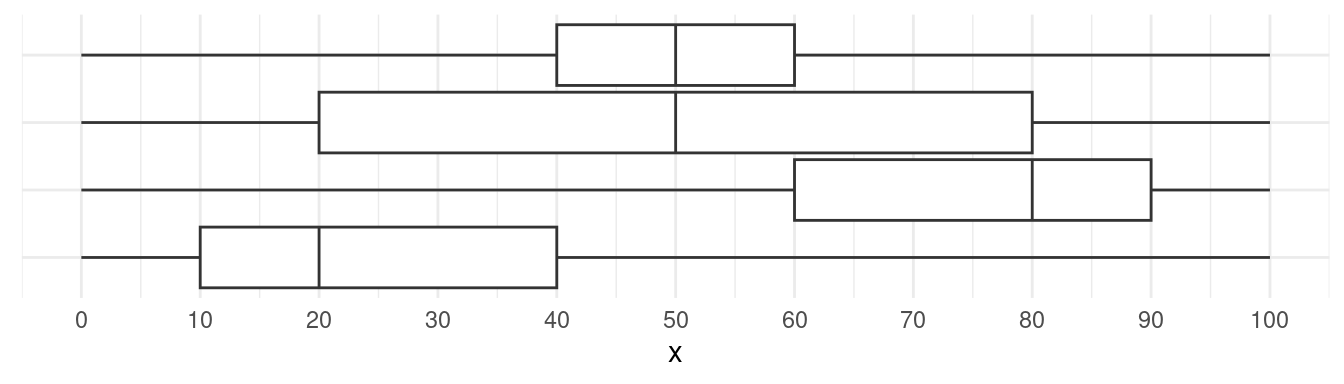
Consider the following plot of four samples and their cumulative distributions. Match each cumulative distribution plot with the box plot below that depicts the same distribution.
- Consider the following cumulative distribution.
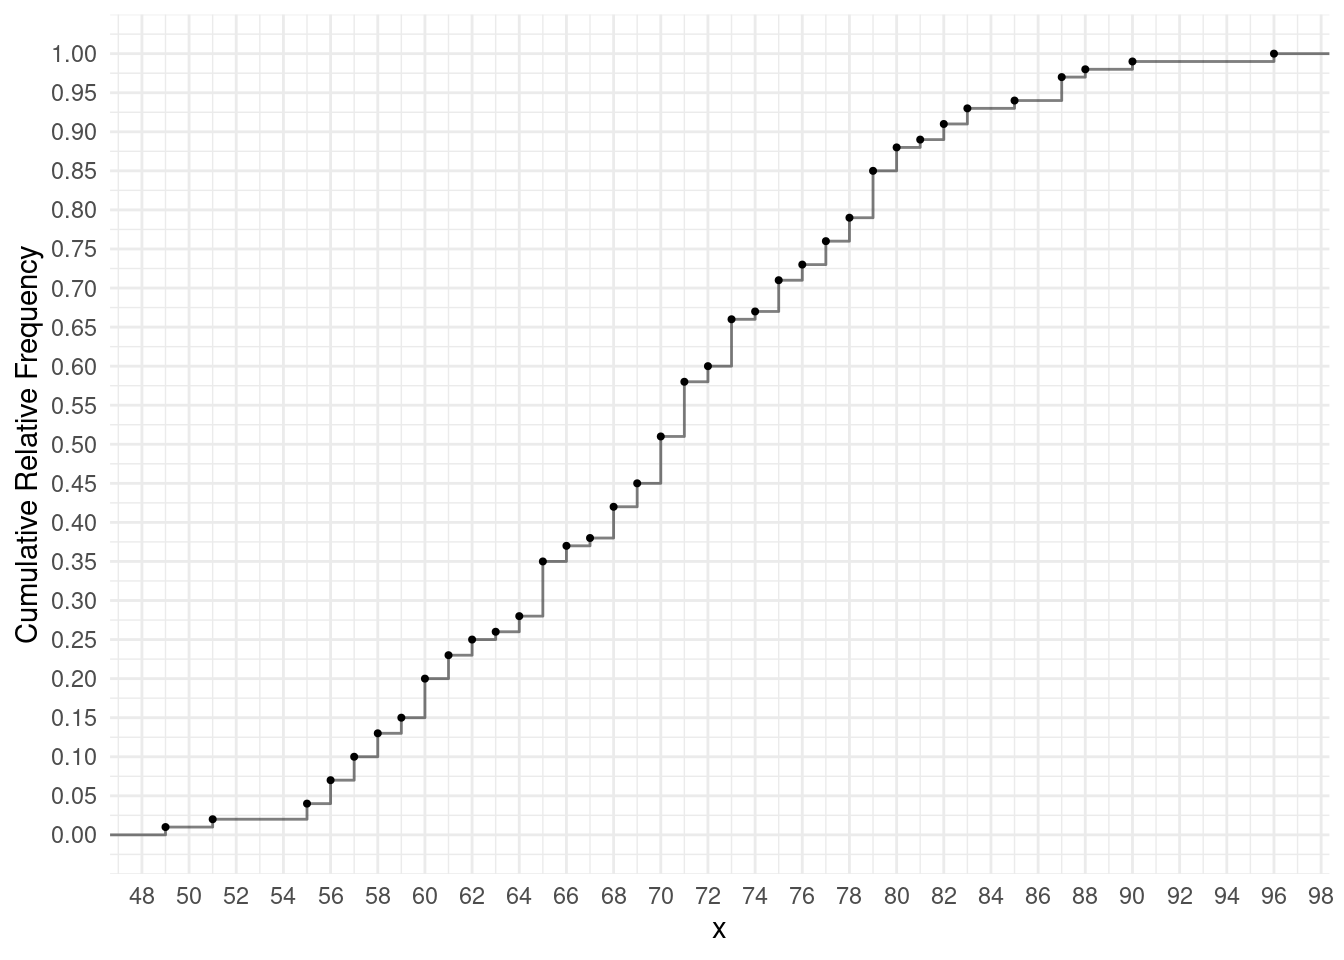 Find the 5th and 95th percentiles using the plot.
Solutions
The 25th, 50th, and 75th percentiles are 6.5, 7, and 8.5, respectively. The box plot is also shown below.
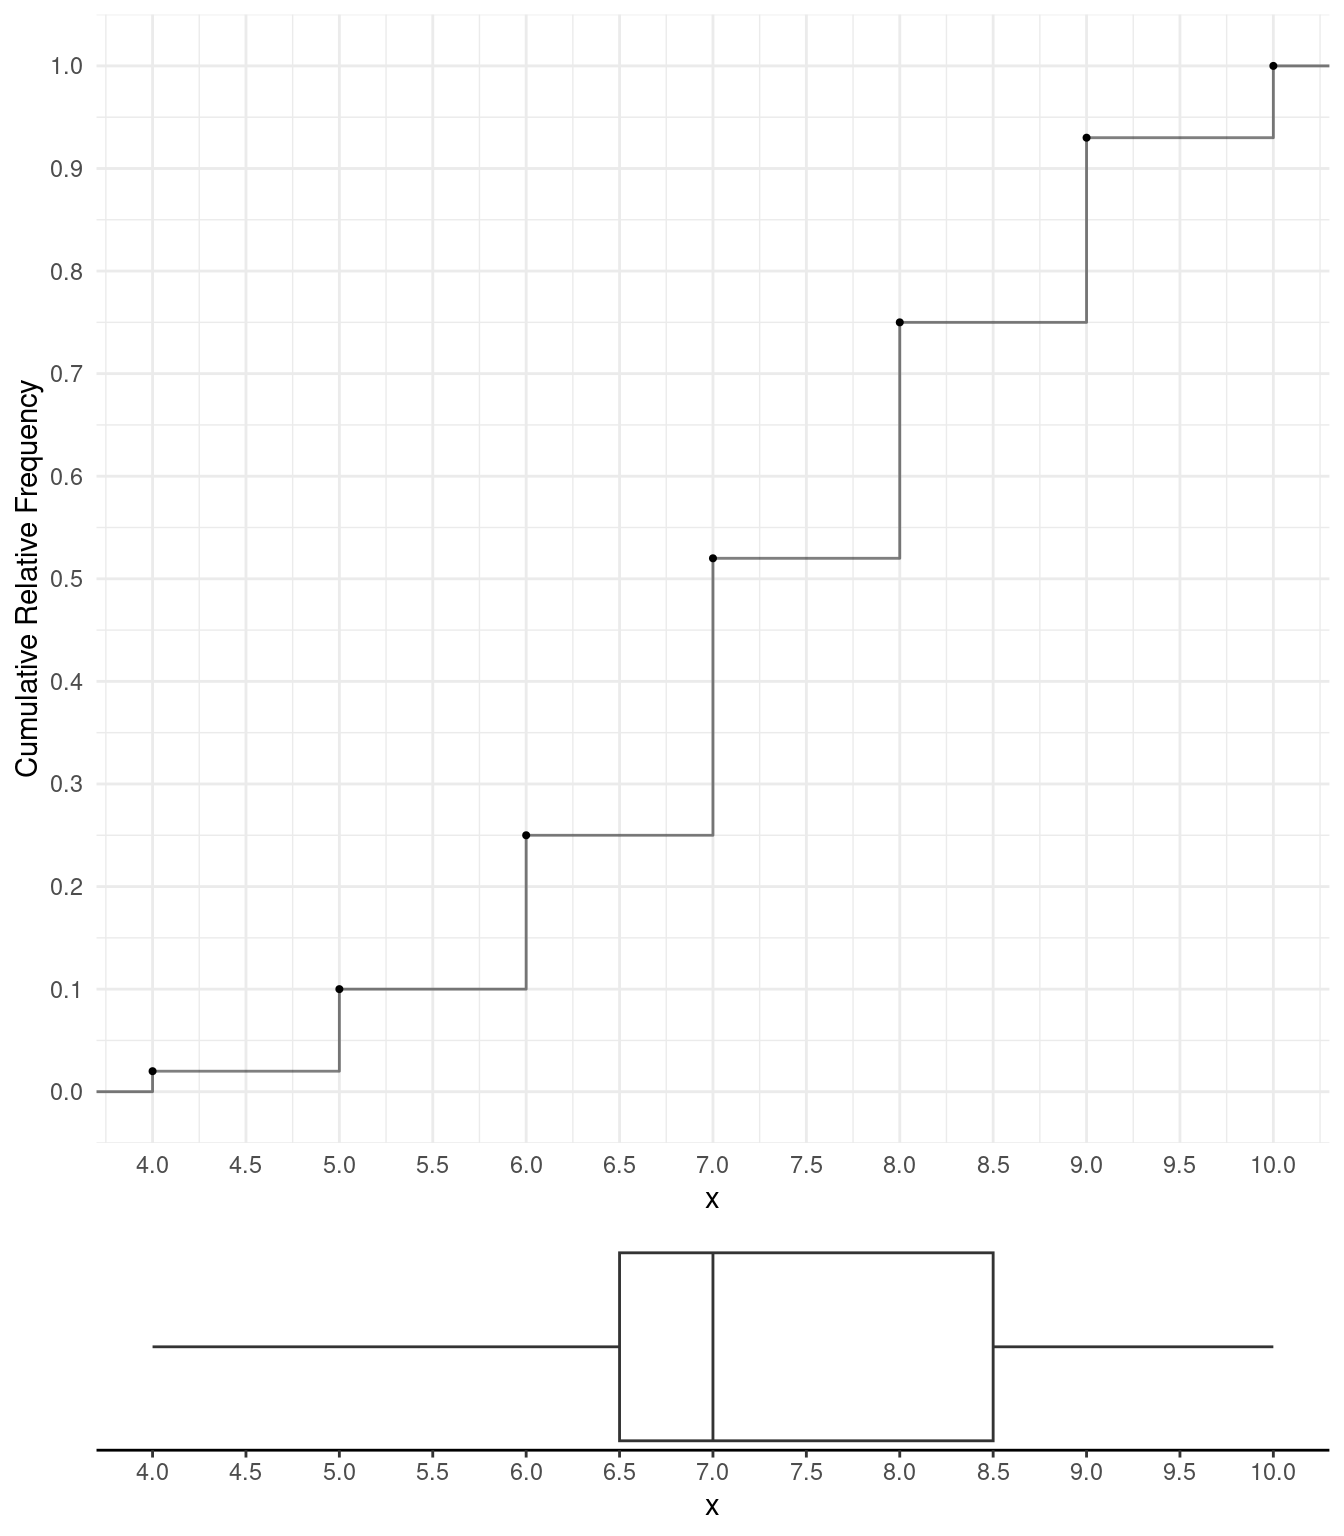 Note that the five number summary is 4, 6.5, 7, 8.5, and 10. So the
median is 7, the range is 6, and the interquartile range is 2.
Note that the five number summary is 4, 6.5, 7, 8.5, and 10. So the
median is 7, the range is 6, and the interquartile range is 2.The 25th, 50th, and 75th percentiles are 2, 3, and 4, respectively. The box plot is also shown below.
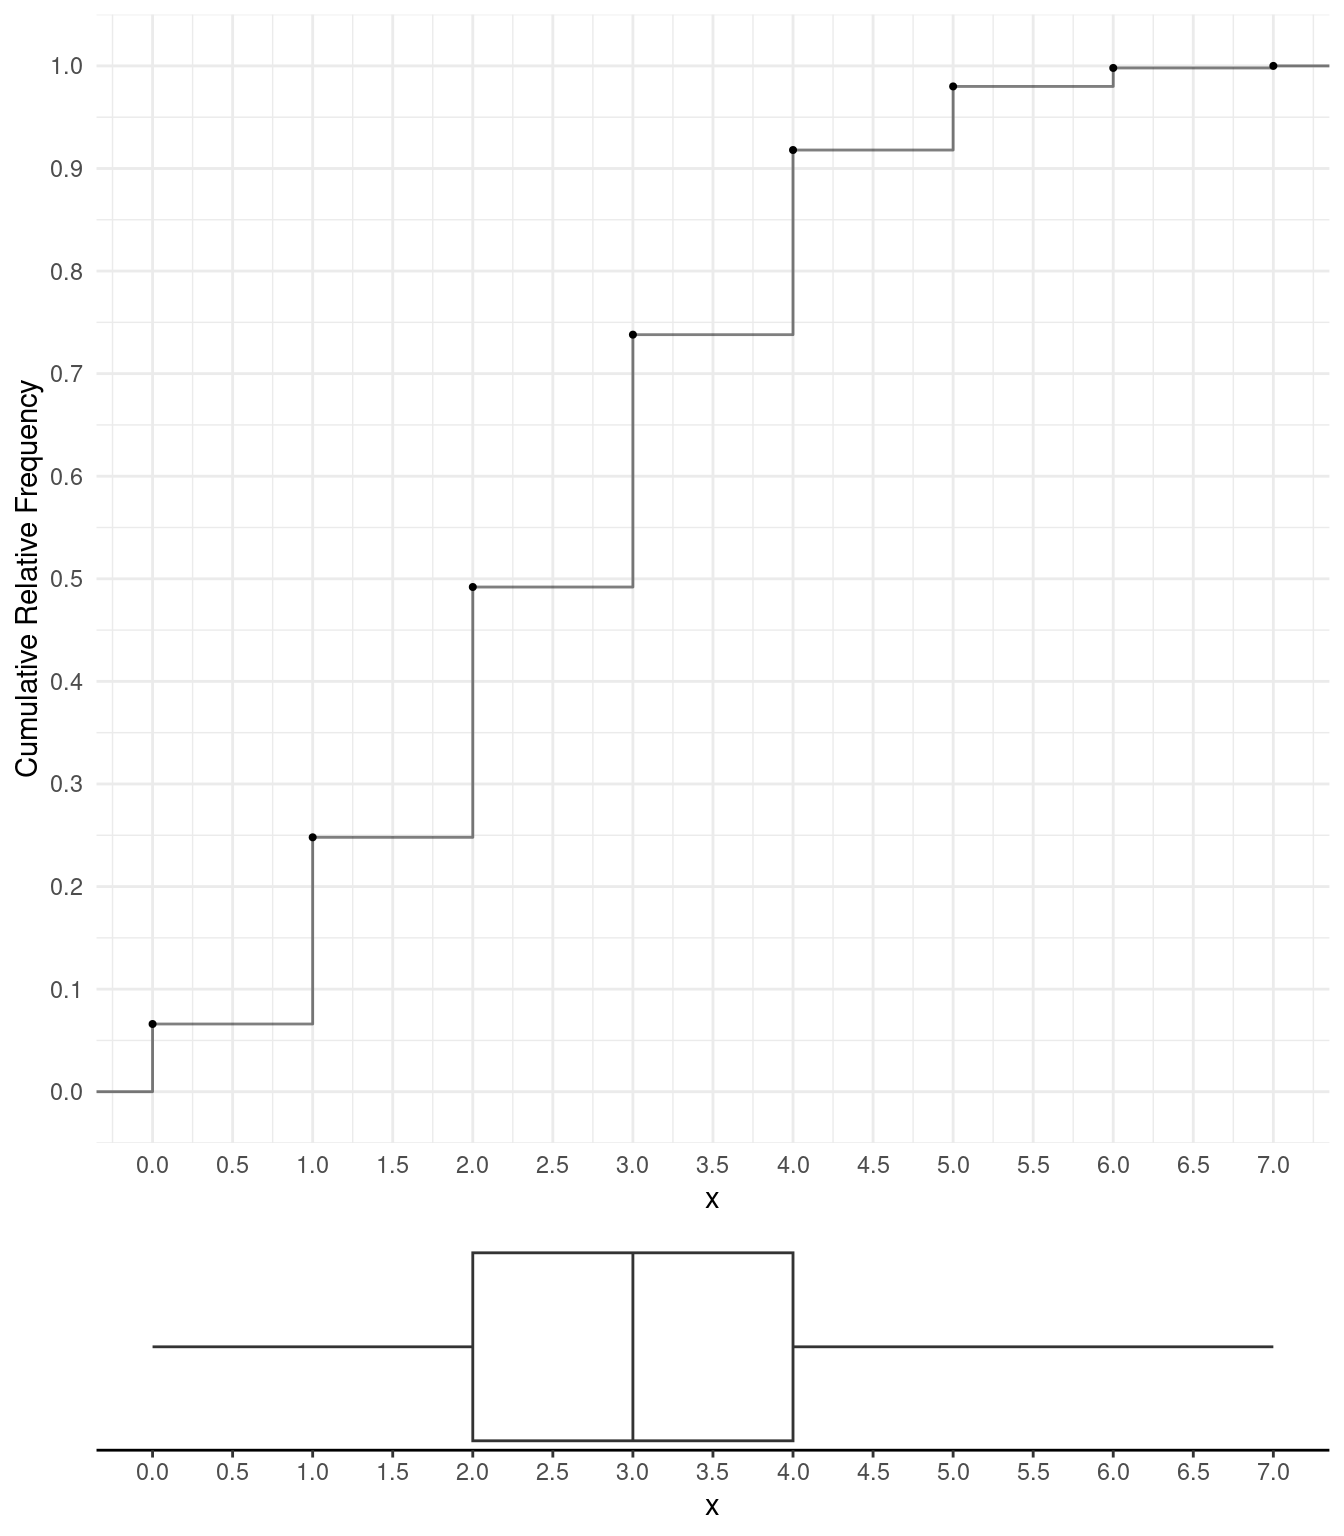 Note that the five number summary is 0, 2, 3, 4, and 7. So the median is
3, the range is 7, and the interquartile range is 2.
Note that the five number summary is 0, 2, 3, 4, and 7. So the median is
3, the range is 7, and the interquartile range is 2.From top to bottom, the box plots correspond to cumulative distributions d, c, b, and a.
The 5th and 95th percentiles are 56, and 87, respectively.